
Why Your Analytics Migration Is an Investment, Not a Cost
- SaaS & Tech
- Finance, Fintech & Investment
TL;DR
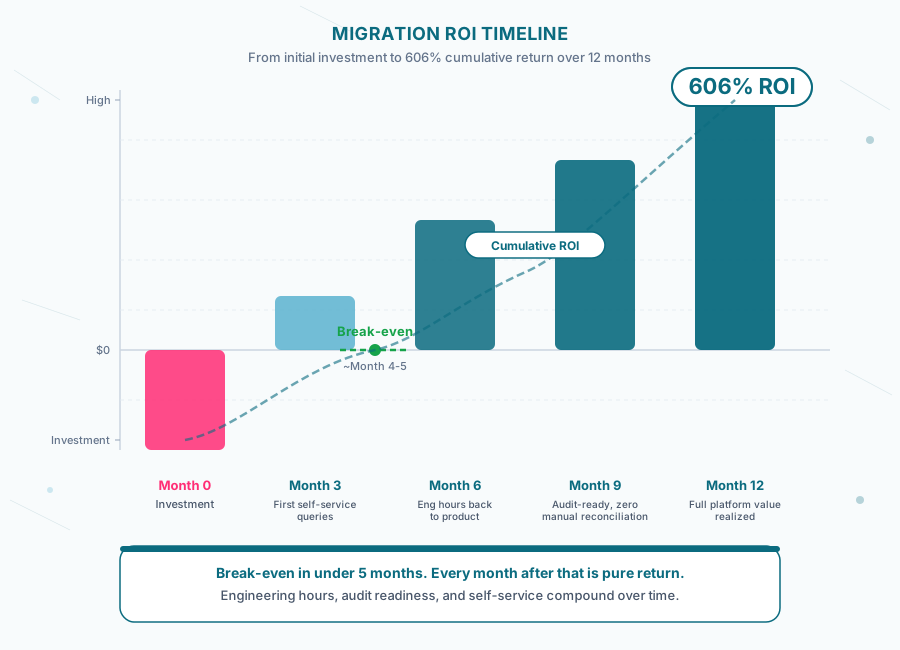
A cloud security company's analytics migration from legacy BI to dbt and Snowflake delivered 606% Year 1 ROI by replacing 377 fragile legacy objects with a 161-model platform in 5 months: dashboard load times dropped from 60 seconds to under 3 seconds for 50+ daily users, Finance gained self-service pricing control instead of waiting days to weeks on engineering tickets (about 120 engineering hours per year recovered), and reconciliation surfaced 15 silent bugs that had been distorting revenue numbers. The migration also validated financial calculations to 0.002% variance against the legacy system.
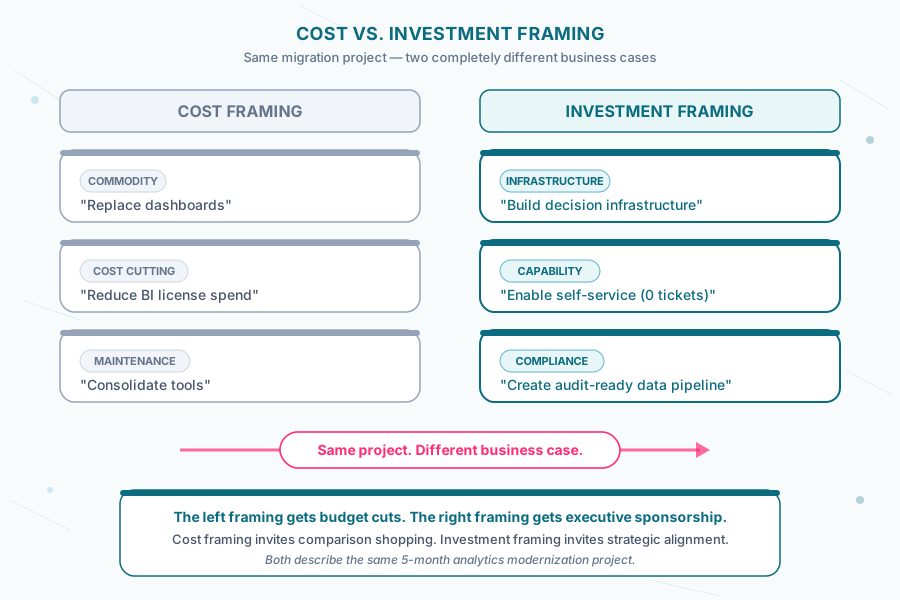
Key takeaway — When the board asks why you’re replacing dashboards that work, the answer isn’t about dashboards — it’s about building the data infrastructure that every future initiative depends on. A cloud security company’s migration delivered 606% Year 1 ROI, Finance independence, and 15 silent bugs fixed.
The Hidden Costs of Legacy BI
A cloud security company was running its revenue analytics on a legacy BI platform. The dashboards worked. The numbers came out. Nobody questioned them.
Until they did.
What “working” actually looked like:
Engineering dependency for every change. When Finance needed to update a pricing rate — something that should take 5 minutes — it required an engineer to edit SQL, open a pull request, get code review, deploy to production, and verify the output. Total time: days to weeks. Total cost: engineer hours diverted from product work.
No audit trail. When auditors asked “how is this revenue number calculated?”, the answer was “let me trace through 20 SQL views and hope the logic matches what’s documented.” There was no lineage, no version history, no way to prove calculation accuracy.
Silent data quality issues. Duplicate records were inflating metrics. Nobody knew. Undocumented pricing tiers were producing wrong numbers. Nobody knew. Date boundary definitions were off by one month. Nobody knew — until the migration uncovered 15 silent bugs.
Fragile infrastructure. 377 legacy objects with overlapping logic. Multiple versions of the same calculation across different dashboards. One wrong edit could cascade through the entire reporting stack with no automated testing to catch it.
The Business Case: 606% Year 1 ROI
The migration replaced the legacy system in 5 months. This is what the investment produced:
Quantifiable Returns
| Category | Impact |
|---|---|
| Engineering time recovered | Pricing updates went from days/weeks (engineer involvement) to minutes (Finance self-service). At one update per month, that’s ~120 engineering hours/year returned to product work. |
| Dashboard performance | 60-second load times → under 3 seconds. Across 50+ daily users, that’s hours of cumulative wait time eliminated weekly. |
| Warehouse compute savings | Pre-computed fact tables replaced raw SQL on every dashboard load. Query costs dropped proportionally to the 90% speed improvement. |
| Audit readiness | Previously required multi-day scrambles to reconstruct calculation lineage. Now available on-demand from dbt’s built-in documentation. |
| Error correction | 15 silent bugs fixed — including duplicate data inflating key metrics and miscalculated pricing tiers. The cost of these errors compounding undetected is incalculable. |
Strategic Returns (Harder to Quantify, Higher Value)
Finance independence. The Finance team now owns pricing — rates, regional multipliers, account discounts — through a self-service dashboard interface. No git, no code, no engineering tickets. This isn’t a cost saving; it’s an organizational capability that didn’t exist before.
Platform scalability. What started as 20 revenue views became a 161-model analytics platform serving 7 product teams. The architecture supports adding new domains without restructuring existing ones. This is infrastructure that compounds in value.
AI-ready foundation. Clean, well-documented data models are prerequisites for any AI initiative — whether it’s a semantic layer chatbot, predictive forecasting, or automated anomaly detection. The migration created this foundation as a side effect.
Five Questions Worth Asking
These are the questions I ask when helping a company build the business case for an analytics migration. The answers tend to be more revealing than any vendor demo.
1. “How much engineering time goes to BI maintenance?”
If data engineers spend more than 10% of their time on ad-hoc report changes, pricing updates, or dashboard debugging, that’s a modernization signal.
2. “Can Finance update pricing without Engineering?”
If the answer is no, you have a process dependency that scales poorly. Every pricing change is an engineering ticket, and every ticket has an opportunity cost.
3. “When was our last data quality audit?”
If the answer is “we don’t do those” or “it’s been a while,” your current numbers may be wrong. The cloud security company found 15 bugs during migration — bugs that had been silently affecting revenue calculations.
4. “How long would it take to show an auditor how we calculate revenue?”
If the answer is “a few days” instead of “I can pull up the lineage right now,” you have an audit risk that grows with every quarter.
5. “What happens when our key data person leaves?”
If knowledge lives in one person’s head instead of in documented, version-controlled code, you have a bus-factor problem with financial implications.
The Migration Pattern That Works
Based on our experience with multiple analytics modernization projects:
Phase 1: Parity (prove it works). Replicate the existing logic exactly. Run old and new systems in parallel. Validate to <0.01% variance on financial metrics. This builds trust with stakeholders who are skeptical of change.
Phase 2: Self-service (prove it’s better). Move business-owned data — pricing, rates, mappings — from engineer-maintained code to self-service interfaces. This is the moment Finance sees the value.
Phase 3: Platform (prove it scales). Use the architecture to onboard additional domains: product usage, customer analytics, operational metrics. The first migration is the hardest; each subsequent one is faster because the foundation exists.
Phase 4: Intelligence (prove it compounds). Layer AI capabilities on the clean data foundation — semantic search, anomaly detection, forecasting. The prerequisite work is already done. This is where ROI accelerates.
What the Numbers Actually Say
Analytics migration isn’t about replacing dashboards. It’s about whether your business will have the data infrastructure it needs for the next five years — or spend those years patching the same fragile, engineer-dependent system.
606% Year 1 ROI. 0.002% variance on revenue. Finance independence from Engineering. 15 silent bugs fixed.
Those aren’t migration metrics. They’re business outcomes.
If your team is debating whether to modernize legacy BI, we can help you build the business case with real numbers. Let’s talk.
Frequently asked questions
What kind of ROI can an analytics migration actually deliver?
In this case, 606% Year 1 ROI, built from concrete line items rather than a soft estimate: about 120 engineering hours per year returned to product work because Finance could update pricing itself instead of filing tickets, dashboard load times cut from 60 seconds to under 3 seconds for 50+ daily users, warehouse compute costs dropping in proportion to that 90% speed improvement, and 15 silent data bugs fixed that had been distorting revenue and pricing calculations. Audit readiness also went from a multi-day scramble to on-demand lineage from dbt's documentation.
Why does Finance having to ask Engineering for pricing changes matter?
Before the migration, a pricing rate update that should take 5 minutes required an engineer to edit SQL, open a pull request, get it reviewed, deploy to production, and verify the output, a process taking days to weeks. After the migration, Finance updated rates, regional multipliers, and account discounts itself through a self-service interface, no git, no code, no engineering ticket. That's not just a time savings, it's an organizational capability: engineering hours returned to product work and Finance no longer blocked on someone else's queue.
How do you know your legacy BI system has silent data quality problems?
Ask when the last data quality audit happened. If the answer is "we don't do those" or "it's been a while," the current numbers may already be wrong. In this migration, reconciling the legacy and new systems in parallel surfaced 15 silent bugs, including duplicate records inflating key metrics, undocumented pricing tiers producing wrong numbers, and date boundaries off by a month, none of which had been caught by the legacy system's own testing, because there wasn't a second system to compare against.
What does a successful analytics migration actually look like in phases?
Four phases: Parity, replicate existing logic exactly and run old and new systems in parallel, validating to under 0.01% variance on financial metrics to build stakeholder trust; Self-service, move business-owned data like pricing and rates to interfaces Finance can use directly; Platform, use the same architecture to onboard other domains like product usage and customer analytics; and Intelligence, layer AI capabilities such as semantic search or forecasting onto the clean data foundation. In this case the migration went from 20 revenue views to a 161-model platform serving 7 product teams.
What questions should a company ask before deciding to modernize legacy BI?
Five: how much engineering time goes to BI maintenance (over 10% is a modernization signal); can Finance update pricing without Engineering; when was the last data quality audit; how long would it take to show an auditor exactly how revenue is calculated; and what happens if the one person who understands the current system leaves. In this case, the honest answers, days-long pricing updates, no recent audit, no on-demand lineage, one key person holding institutional knowledge, were what justified the business case for the migration.