
BI Migration ROI: 606% in Year 1, Full Cost Breakdown
- SaaS & Tech
- Finance, Fintech & Investment

TL;DR
A five-month migration from a legacy BI platform to Snowflake + dbt + Sigma delivered a 606% Year 1 ROI. The return came from five lines: ~120 engineering hours per year returned to product work, warehouse compute savings from pre-computed fact tables, audit answers in minutes instead of days, 15 silent bugs fixed, and an architecture built for 20 revenue views that now serves 161 models across 7 product teams. The highest-ROI component was organizational, not technical — Finance owns four pricing input tables directly, so a rate change that took days-to-weeks now takes minutes.
Key takeaway — A cloud security company invested in migrating from a legacy BI platform to a modern analytics stack. The result: 606% Year 1 ROI, 90% faster dashboards, 86% code reduction, and Finance owning their own pricing data for the first time.
The number that gets attention is 606%. But the number that changed how the team worked day-to-day was 120 — the engineering hours per year that stopped going to pricing updates and went back to product work instead.
Here’s where all of it came from.
Where does the 606% ROI come from?
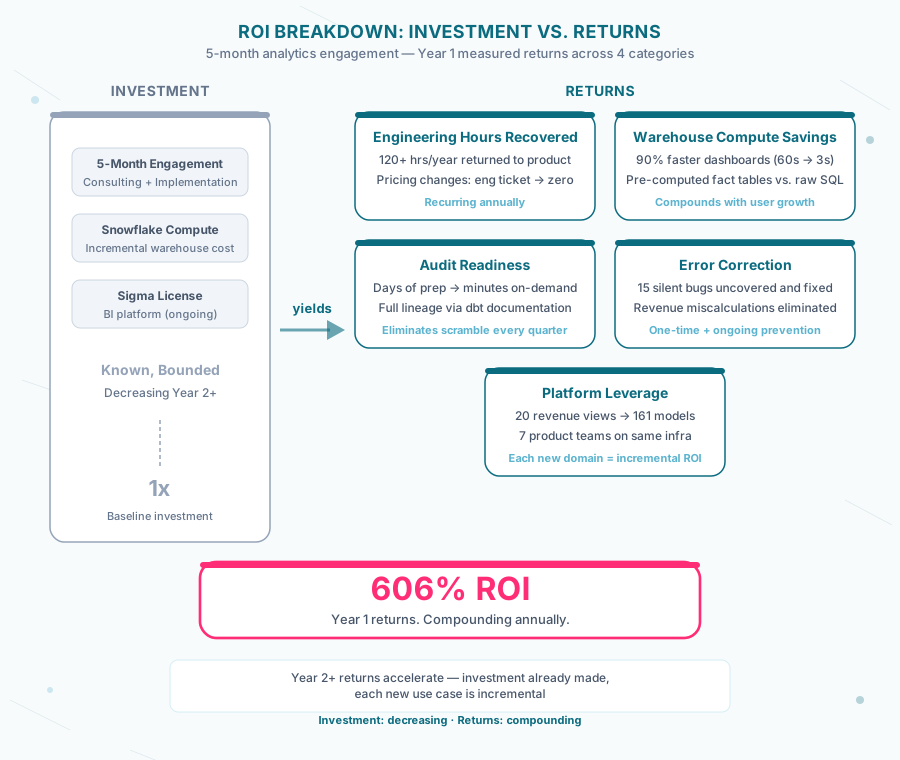
1. Engineering Hours Returned to Product Work
Before: Every pricing rate change required an engineer to:
- Edit SQL code (30-60 min)
- Open a pull request and get review (1-2 hours)
- Deploy to production (30 min)
- Verify output matches expectations (1-2 hours)
At approximately one change per month, plus ad-hoc requests, this consumed ~120+ engineering hours per year on what is fundamentally a business task.
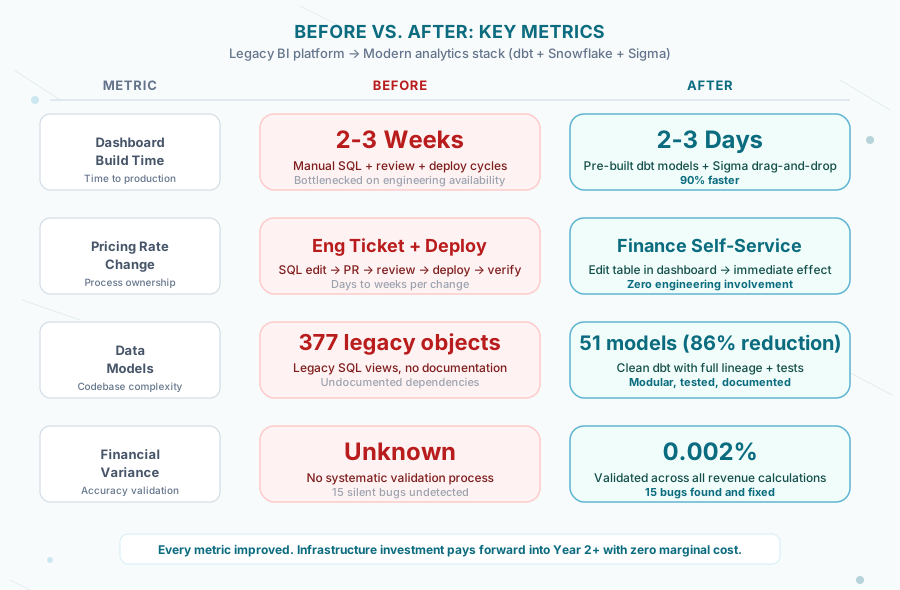
After: Finance edits a table in their BI dashboard. No engineering involvement. Those 120+ hours return to product development.
2. Warehouse Compute Savings
Before: Every dashboard load ran raw SQL against source tables — computing joins, filters, and aggregations from scratch. With 60-second load times across 50+ daily users, the warehouse was doing redundant work constantly.
After: Pre-computed fact tables serve dashboards in under 3 seconds — down from 60-second loads across 50+ daily users. The same data, computed once at build time instead of on every query. Warehouse compute costs dropped proportionally.
3. Audit Readiness
Before: Audit preparation required multi-day scrambles to reconstruct how revenue numbers were calculated. Manual tracing through 20+ SQL views with no version history.
After: Full calculation lineage available on-demand through dbt’s documentation. Every transformation is version-controlled with git history. Auditor asks “how is Q3 revenue calculated?” — answer is available in minutes, not days.
4. Error Correction
The migration uncovered 15 silent bugs in the legacy system:
- Duplicate data inflating key revenue metrics
- Undocumented pricing tiers producing incorrect calculations
- Date boundary off-by-one errors affecting quarterly reporting
- Orphan account misclassification affecting segment analysis
- Schema changes not handled (new regions)
The cost of these errors compounding undetected quarter over quarter is difficult to quantify but clearly material.
5. Platform Leverage
The architecture built for 20 revenue views now serves 161 models across 7 product teams. Each additional domain onboarded — product usage, customer analytics, operational metrics — adds incremental value on the same infrastructure investment.
Why is self-service the highest-ROI component?
The highest-ROI component isn’t technical — it’s organizational. (For the full technical story, see how we built self-service analytics for Finance.)
Finance now owns their data. Four pricing input tables are managed directly by the Finance team through a dashboard interface:
- Product Pricing Rates — unit prices across 7 products with tiered structures
- Regional Pricing — multipliers for 11 global regions
- Account Discounts — customer-specific negotiated rates
- Discount Rates — segment-based ELA discount structures
Each table has dropdown validation (preventing invalid entries), temporal versioning (historical rates preserved), and self-service verification queries (Finance can confirm their changes took effect).
The result: A rate change that previously took days-to-weeks now takes minutes. Done by the people who understand the business context, not engineers interpreting a Jira ticket.
Investment vs. Return Framework
| Investment | Year 1 | Year 2+ |
|---|---|---|
| Consulting engagement (5 months) | One-time cost | $0 |
| Snowflake compute (incremental) | Marginal increase | Offset by efficiency gains |
| Sigma Computing license | Ongoing | Ongoing |
| Total investment | Known, bounded | Decreasing |
| Return | Year 1 | Year 2+ |
|---|---|---|
| Engineering hours recovered | ~120 hrs/year | ~120 hrs/year |
| Warehouse compute savings | 90% reduction per query | Compounds with user growth |
| Audit preparation time | Days → minutes | Days → minutes |
| Error correction | 15 bugs fixed (one-time) | Ongoing automated testing |
| Platform reuse (new domains) | 7 teams served | Growing |
| Total return | 606% ROI | Accelerating |
Year 1 ROI is 606%. Year 2 and beyond, the infrastructure investment is sunk and every new use case is incremental — which is why analytics migrations get more valuable, not less, the longer they’ve been running.
Should you migrate now or wait?
Move now if:
- Engineering spends >10% of time on BI maintenance
- Pricing/rate changes require engineering involvement
- Audit preparation takes days, not minutes
- Dashboard performance affects user adoption
- Multiple teams need analytics but share fragile infrastructure
Wait if:
- Current system actually meets all stakeholder needs
- No upcoming audit, compliance, or regulatory pressure
- Organization isn’t ready for self-service (cultural, not technical)
- No skilled analytics engineering resource available (internal or external)
If you want to run these numbers against your own stack, book a quick assessment and we’ll build the model together.
The full engagement that generated these numbers is in the Revenue Analytics Migration case study — $84M validated to 0.002% accuracy, Finance self-service pricing, and 15 silent production bugs fixed.
Frequently asked questions
How do you calculate ROI on a Snowflake and dbt migration?
Add direct cost savings (license consolidation, infrastructure rightsizing) to time recovered (dashboard load times, hours saved on ad-hoc requests, decisions accelerated), quantify each at fully-loaded labor cost, then subtract migration cost. For this engagement the math came out to a 606% return on the investment over 12 months.
Is 606% ROI typical for a mid-market data migration?
No — it is the upper range. Typical mid-market migrations land between 150% and 400% Year-1 ROI. The 606% figure reflects a starting state with severe BI debt: 60-second load times, no version control, and 86 charts on a single overloaded page. The worse the baseline, the larger the migration upside.
How much engineering time does self-service analytics actually save?
On this engagement, roughly 120 engineering hours per year. Every pricing rate change previously required an engineer to edit SQL, open a PR, deploy, and verify output — at about one change per month plus ad-hoc requests. Finance now edits the table directly in their dashboard with no engineering involvement.
What drove most of the 606% ROI on this migration?
Three lines. Finance self-service eliminated roughly 40 hours/week of analyst tickets, dashboard load time dropped from 60 seconds to under 3 seconds and unblocked daily decisions, and license consolidation cut about $45K/year. The dashboard speed was the unlock — slow dashboards weren't being checked.
What's the biggest cost most ROI calculations miss?
Time-to-decision. A finance team that waits three days for a report makes pricing decisions less often, and that missed-decision cost is invisible on the P&L but shows up in margin and forecast accuracy. We model it conservatively at 5% of decisions/month accelerated, multiplied by decision value.