
Cortex Analyst on Real Financial Data: What Worked
- SaaS & Tech

TL;DR
You make an LLM answer from governed company data by putting a semantic layer between the model and the warehouse: you define the facts, dimensions, and metrics once — on top of tested dbt models — and the LLM writes SQL only against those definitions instead of against raw tables. We built exactly that on Snowflake with Cortex Analyst over a mart-layer dbt fact table validated to 0.002% accuracy, wired it to a Streamlit-in-Snowflake app, and the aggregation answers matched the Sigma dashboards built on the same models. The caveats are all metadata problems: anything the semantic layer does not define — derived ratios, a 4-4-5 fiscal calendar, three stacked filters — is where answers go quietly wrong, so pre-define every metric users will ask for and keep the semantic view in sync with the models underneath it.
Key takeaway — Nobody writes about building Cortex Analyst on production financial data. We had 90 dbt models (at that point in the engagement), 6 product lines, 11 regional pricing multipliers, and a live financial dataset validated to 0.002% accuracy. We built a semantic view on top of a mart-layer fact table, wired it to a Streamlit-in-Snowflake app, and validated the results against our Sigma dashboards. The aggregation queries matched. The custom calendar queries didn’t. The semantic view definition turned out to be more demanding than the documentation suggests — and more valuable than we expected.
Nobody writes about building Cortex Analyst on production data. The tutorials use toy datasets. The demos show clean schemas. The documentation assumes you’re starting from scratch.
We weren’t starting from scratch. We had 90 dbt models (at that point in the engagement), six product lines, 11 regional pricing multipliers, and production-validated revenue data across six product lines. We wanted to know if a finance stakeholder could ask “what’s net revenue by product for Q3?” in plain English and get a correct answer — without writing SQL, without a data analyst in the loop, and without a demo schema that was designed to behave.
This is what we found out.
Quick answer: Cortex Analyst on real dbt financial data works, with meaningful caveats. Semantic view definitions require more precision than the docs suggest. Query results validated against Sigma — they matched. The biggest surprise wasn’t the AI layer; it was how much work the semantic layer itself demands. Plan for that.
How do I put an LLM on my company’s data safely?
You do not point it at the schema. You put a semantic layer in between.
The safe pattern has three parts, in this order. First, a modeled and tested foundation — dbt models whose numbers have already been reconciled against something independent, because an AI layer on unvalidated data produces confident answers nobody can defend. Second, a semantic layer that names the facts, dimensions, and metrics in business terms and defines every metric as a single deterministic expression. Third, an interface that shows the SQL it generated, so any answer can be checked instead of trusted.
The model’s job in this architecture is translation, not arithmetic — it turns a question into a query, and the warehouse does the math. That one design decision is what separates a system a CFO will sign off on from a chatbot that guesses. The model never sums a column; it picks which pre-defined metric to sum, and Snowflake computes it exactly the way it computes it for the dashboard.
This is the sequencing we use on AI strategy engagements: governed foundation, then semantic layer, then the AI on top. Skipping to step three is the most common way these projects die in the demo.
What is a semantic layer for AI, and why does it make answers trustworthy?
A semantic layer is a definition of your business in machine-readable form: which tables hold facts, which columns are dimensions worth grouping by, and — the part that matters most — what each metric means as an exact expression. “Net revenue” stops being a phrase people interpret and becomes SUM(revenue_net) on a specific table at a specific grain.
That is what makes AI answers reproducible. Ask a raw text-to-SQL system for “effective discount rate” and it will invent a formula out of column names — plausibly, confidently, and differently on Tuesday than it did on Monday. Ask the same question against a semantic layer where effective_discount_rate is defined once, and there is exactly one SQL expression it can emit. A semantic layer does not make the model smarter; it makes the space of possible answers smaller, which is the only kind of reliability that survives a finance review.
The other half of the value is that those definitions are code. They live in the same repo as the dbt models, they get reviewed in the same pull request, and when the definition of net revenue changes, the dashboard and the AI answer change together instead of drifting apart. A metric that exists in three tools and a spreadsheet has four definitions. A metric that exists in the semantic layer has one.
What the model reads, by design, is metadata — tables, columns, metrics, and whatever comments you wrote — not your rows. (Some semantic-model configurations let you expose sample column values to help the model interpret literals; that is a deliberate choice worth reviewing with whoever owns your data policy.) The rows get touched when the generated SQL runs in your warehouse, under the same role and the same policies as any other query.
Why is conversational analytics on financial data worth attempting?
The org we were working with — a cloud security company — had a working Sigma environment by the time we started this experiment. Dashboard loads that used to take 60 seconds now ran in under 3. Finance could update pricing without filing a Jira ticket. The migration was done.
But there was still a class of questions that required either a data analyst or someone patient enough to find the right Sigma workbook and apply the right filters. “How much of our Q3 revenue came from accounts in the POC segment?” “What’s our effective discount rate across product categories this month?”
Reasonable questions. Minutes to answer if you know where to look. Invisible if you don’t.
Cortex Analyst’s pitch for this scenario: you already have the dbt models. You build a semantic view on top of them — telling Snowflake what the facts, dimensions, and metrics mean — and Cortex translates natural language queries into SQL against that semantic view. The SQL runs in Snowflake. The results come back to whatever UI you’ve built.
The part nobody writes about: building a semantic view on a real financial schema is not like building one on orders and customers.
What is Snowflake Cortex Analyst?
Cortex Analyst is Snowflake’s managed natural-language-to-SQL service. You give it a semantic model — in our case a Snowflake semantic view built over a dbt mart table — and it answers plain-English questions by generating SQL constrained to that model, executing it in your warehouse, and handing back both the result and the SQL it wrote.
Two properties matter more than whatever model sits behind it. It is scoped: Cortex Analyst can only query what the semantic view exposes, which makes that view simultaneously your metric dictionary and your blast radius. And it is inspectable: because the generated SQL comes back with the answer, “how did you get that number?” has a real answer — which is the second question every finance stakeholder asks.
Cortex is a fast-moving surface. Everything below is what we observed during a November 2025–March 2026 engagement; check current Snowflake documentation before designing around any specific behavior.
What does the semantic view look like on a real dbt mart?
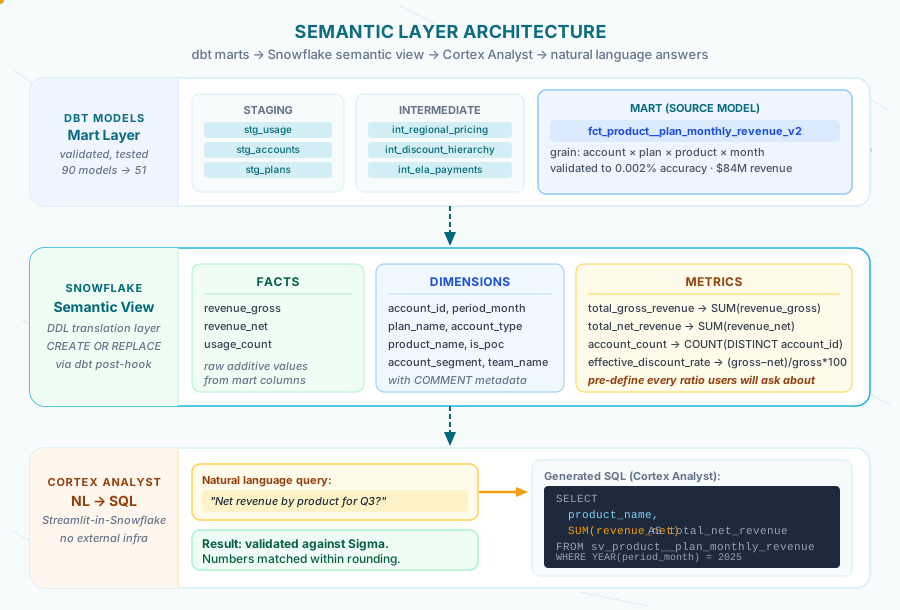
The source model was fct_product__plan_monthly_revenue_by_product_v2 — a mart-layer table with rows at the grain of account × plan × product × month. It was the output of a 51-model dbt architecture that had been validated to 0.002% accuracy against historical invoices.
We wrapped a Snowflake DDL macro around the semantic view definition. The full structure:
{% macro create_sv_product__plan_monthly_revenue() %}
  {% set sql %}
    CREATE OR REPLACE SEMANTIC VIEW {{ db }}.{{ schema }}.sv_product__plan_monthly_revenue

      TABLES (
        revenue AS {{ db }}.{{ schema }}.fct_product__plan_monthly_revenue_by_product_v2
          PRIMARY KEY (account_id, plan_id, period_month, product_id)
      )

      FACTS (
        revenue.revenue_gross AS revenue_gross,
        revenue.revenue_net AS revenue_net,
        revenue.usage_count AS usage_count
      )

      DIMENSIONS (
        revenue.account_id AS account_id,
        revenue.period_month AS period_month,
        revenue.plan_name AS plan_name,
        revenue.account_type AS account_type,
        revenue.account_segment AS account_segment,
        revenue.is_poc AS is_poc,
        revenue.product_name AS product_name,
        revenue.product_category AS product_category,
        revenue.team_name AS team_name
      )

      METRICS (
        revenue.total_gross_revenue AS SUM(revenue.revenue_gross),
        revenue.total_net_revenue AS SUM(revenue.revenue_net),
        revenue.total_ela_discount AS SUM(revenue.revenue_gross) - SUM(revenue.revenue_net),
        revenue.account_count AS COUNT(DISTINCT revenue.account_id),
        revenue.effective_discount_rate AS
          (SUM(revenue.revenue_gross) - SUM(revenue.revenue_net))
          / NULLIF(SUM(revenue.revenue_gross), 0) * 100
      )

      COMMENT = 'Plan-level monthly revenue by product.'
  {% endset %}

  {% do run_query(sql) %}
{% endmacro %}
The macro runs via dbt run-operation. It’s idempotent — CREATE OR REPLACE means re-running it on schema changes is safe. We called it from a post-hook on the source mart so the semantic view stayed current as the model evolved.
Keeping the semantic view in the dbt repo is the whole point: it gets versioned, reviewed, and deployed on the same path as the models it sits on, instead of being maintained by hand in a UI where nobody can diff it. That holds whether you run dbt Cloud, dbt Core, or Snowflake’s native dbt runner — run-operation and post-hooks work the same way in all three.
How do you put a usable interface on top?
We ran the Cortex Analyst interface as a Streamlit-in-Snowflake app — no external infrastructure, no API keys to manage outside Snowflake, native access to the semantic view.
The app structure was straightforward: a text input, the Cortex Analyst API call using the snowflake.cortex.complete inference pattern, and automatic chart rendering based on what came back.
import streamlit as st
import pandas as pd
from snowflake.snowpark.context import get_active_session

session = get_active_session()

def query_cortex_analyst(question: str, semantic_view: str) -> dict:
    """Send NL question to Cortex Analyst, get back SQL + results."""
    response = session.sql("""
        SELECT SNOWFLAKE.CORTEX.ANALYST(
            ?,
            OBJECT_CONSTRUCT('semantic_view', ?)
        ) AS response
    """, params=[question, semantic_view]).collect()
    return response[0]["RESPONSE"]

def render_chart(df: pd.DataFrame):
    """Auto-detect chart type: temporal → line, categorical → bar."""
    date_cols = [c for c in df.columns if any(t in c.lower() for t in ["month", "date", "period"])]
    revenue_cols = [c for c in df.columns if any(t in c.lower() for t in ["revenue", "amount", "total"])]

    if date_cols and revenue_cols:
        st.line_chart(df.set_index(date_cols[0])[revenue_cols])
    elif revenue_cols:
        cat_col = [c for c in df.columns if c not in revenue_cols][0] if len(df.columns) > 1 else None
        if cat_col:
            st.bar_chart(df.set_index(cat_col)[revenue_cols])
The auto-chart logic covered the most common financial query patterns without configuration. Temporal queries (revenue by month) got line charts. Categorical breakdowns (revenue by product, by segment) got bar charts. Everything else got a table.
If you build one of these, put the generated SQL on the screen. A conversational analytics tool that hides its SQL is asking for trust it hasn’t earned; one that shows it turns every answer into something an analyst can verify in ten seconds. The SQL comes back from the API anyway — the only cost is an expander in the UI, and it converts the tool from an oracle into an interface.
Which questions actually worked?
Cortex Analyst handled aggregation and grouping questions well — the kind of queries that translate naturally into SUM ... GROUP BY:
"What is total gross revenue by month for the current year?"
"Show net revenue by product category"
"Which account segments have the highest revenue?"
"Compare effective discount rate by plan name"
"How many unique accounts are active this quarter?"
The generated SQL was readable. A representative example for “net revenue by product for 2025”:
SELECT
    product_name,
    SUM(revenue_net) AS total_net_revenue
FROM sv_product__plan_monthly_revenue
WHERE YEAR(period_month) = 2025
GROUP BY product_name
ORDER BY total_net_revenue DESC
We validated these results against Sigma. They matched. That’s the part that actually mattered — not whether the app looked impressive, but whether it could produce numbers a finance team would trust.
What are the gotchas nobody mentions?
Every failure we hit was a metadata problem, not a model problem — which is good news, because metadata is the part you control.
Custom calendar queries were unreliable. Our dbt models use a 4-4-5 retail calendar — quarters that don’t match ISO quarters. The semantic view has no mechanism to communicate this. When a user asked “what’s Q3 revenue?”, Cortex Analyst used calendar Q3 (July–September), not the company’s Q3. The SQL was syntactically correct. The number was wrong. We added a note to the Streamlit UI: “This tool uses calendar months. For company quarter numbers, use Sigma.” Not elegant, but honest.
Complex filter combinations degraded quality. Simple group-by questions worked consistently. Multi-condition questions like “net revenue for POC accounts in the Detection product category excluding accounts with custom discounts” produced SQL that was sometimes correct and sometimes subtly wrong — usually a missing filter or an incorrect aggregation order. We couldn’t predict when it would fail without running the output against a known answer. For exploratory queries, acceptable. For Finance sign-off on a number, not acceptable.
Derived metrics need explicit definition. Effective discount rate — (gross - net) / gross * 100 — worked because we defined it explicitly in the METRICS block. Any ratio or derived calculation that we didn’t pre-define either produced incorrect SQL or caused Cortex Analyst to refuse the query with an “I can’t answer that” response. Every metric a user might want to ask about needs to exist in the semantic view. You can’t rely on Cortex inferring ratios from raw facts.
The semantic view is a snapshot. It reflects the mart schema at creation time. When we added a new dimension column to the underlying dbt model, the semantic view didn’t update automatically. CREATE OR REPLACE fixed it, but that requires knowing the change happened. In a team environment without the post-hook pattern we used, semantic views can silently lag behind the data model.
Snowflake Cortex evolves fast. The behavior we observed was current as of our engagement (November 2025–March 2026). Cortex Analyst was still in relatively early availability. API response shapes, supported metric expressions, and query quality all change with Snowflake releases. Treat the specifics here as “what we observed at the time” — validate against current documentation before building on them.
What does the semantic view definition actually require?
The most underestimated part of this work was writing the semantic view itself.
The METRICS block is where precision matters most. Snowflake’s semantic view DDL is strict about metric expressions — you can’t use arbitrary SQL functions, and the reference syntax (revenue.metric_name) has specific rules that differ from standard SQL aliases. We iterated on effective_discount_rate three times before the DDL accepted it without error:
-- First attempt — rejected (division not directly supported as top-level metric)
revenue.effective_discount_rate AS
  (revenue_gross - revenue_net) / revenue_gross * 100

-- Second attempt — rejected (column references without table alias)
revenue.effective_discount_rate AS
  (SUM(revenue_gross) - SUM(revenue_net)) / SUM(revenue_gross) * 100

-- Third attempt — accepted
revenue.effective_discount_rate AS
  (SUM(revenue.revenue_gross) - SUM(revenue.revenue_net))
  / NULLIF(SUM(revenue.revenue_gross), 0) * 100
The NULLIF matters: without it, accounts with zero gross revenue produce a division-by-zero error that surfaces as a confusing Cortex Analyst failure rather than a clear SQL error.
The COMMENT field is not cosmetic. Cortex Analyst uses the view-level and column-level comments to improve query generation. A view-level comment of 'Monthly revenue by product.' produced noticeably better results than no comment for ambiguous queries. We added comments to every dimension that had non-obvious business meaning:
DIMENSIONS (
  revenue.account_segment AS account_segment
    COMMENT 'Customer segment: Internal, External POC, External Upside, Unknown',
  revenue.is_poc AS is_poc
    COMMENT 'Boolean flag — true if this is a proof-of-concept account',
  ...
)
This is the same principle as good dbt model documentation — the AI layer is only as good as the metadata you give it.
Can an LLM query my data warehouse directly?
Technically, yes. You can hand a model your information schema and let it write SQL against raw tables, and every vendor demo that does this works. We wouldn’t recommend it for anything a finance team will act on, for three reasons.
Ambiguity has no tiebreaker. In a real warehouse there are usually several columns that could plausibly be “revenue” — gross, net, recognized, billed, and a staging copy nobody dropped. A model reading raw schema picks one. It isn’t wrong to pick one; there’s nothing in the schema telling it which one the company means. In a semantic layer, there is.
Grain errors are invisible. Join a monthly fact table to something at a coarser grain, sum without deduplicating, and you get a number that looks right and is roughly double. Our semantic view declares the grain — PRIMARY KEY (account_id, plan_id, period_month, product_id) — which removes a whole class of these from the space of queries the model can even write.
The surface is unbounded. Direct schema access means every table is fair game, including the ones with PII in them and the staging models nobody meant to expose. Point an LLM at a semantic view instead, and “what can this thing see?” becomes a one-line answer you can put in front of a security reviewer.
Access control is a related but separate question, and worth being precise about. Generated SQL is still just SQL: masking policies and row access policies apply to it exactly as they apply to a query someone types by hand, and the query runs under whatever role your application uses. That makes “which role does the AI app run as?” one of the first design decisions rather than an afterthought — because a semantic view scopes what can be asked, and Snowflake’s RBAC scopes what can be seen. You want both.
There’s a third layer that gets skipped more often than either: guardrails for the humans and AI assistants working on the system — what they’re allowed to change, how errors get caught, who is accountable. We ship that as a starter kit rather than a handoff doc, for the same reason the semantic view lives in the repo: rules that aren’t in the codebase don’t survive the engagement.
How accurate is this, and do we still need a BI tool?
Accuracy here isn’t one number, because it splits cleanly by question type.
On aggregation and grouping questions — sum this, group by that, filter to a period — our results matched the Sigma dashboards built on the same models. When the metric is pre-defined and the question is a group-by, natural-language-to-SQL is a translation problem, and translation problems are solvable.
On anything requiring multi-step logic, a domain-specific calendar, or three stacked filters, accuracy was unpredictable in a way that matters more than the average hit rate. A system that’s right most of the time and can’t tell you which answers are the exceptions is not a system a finance team can use unsupervised. That’s why showing the generated SQL isn’t a nice-to-have — it’s the control that makes the unreliable band usable at all.
So yes, you still need the BI tool. Sigma stayed in the stack for exactly the queries Cortex Analyst was worst at: fiscal-calendar reporting, multi-filter analysis, the numbers that get signed. What the semantic layer added was a fast path for the long tail of questions that never justified building a dashboard and never quite justified interrupting an analyst. Conversational analytics is a queue-reducer, not a BI replacement — and pricing it as a BI replacement is how these projects end up judged a failure at something they were never doing.
The weekend it came together
Building the Streamlit prototype was a weekend project — the kind you start on a Saturday afternoon expecting to spend two hours on and end up deep in at midnight. The financial data we were querying had been through months of validation.
Seeing it come back from a plain-English question was a different kind of experience.
“Not sure how to feel if data gives me joy during the weekend” — actual Slack message, actual Sunday.
The caveats are real. The fiscal calendar problem is real. The limit on complex filters is real. But so is watching a finance stakeholder type “which product had the highest net revenue last month?” and get the right number back without opening a SQL editor.
The self-service analytics work we’d done with Sigma input tables — described in detail in the B-8 post on empowering finance teams — was already changing who could answer questions in the org. The semantic layer was a further step in the same direction: not replacing analysts, but reducing the queue of questions that required one.
Lessons for production use
Validate the data before wiring the AI. The data quality problem is separate from the NL-to-SQL problem. We had confidence in our answers because the source model had been validated to 0.002% accuracy. Without that foundation, you can’t distinguish a Cortex Analyst failure from a data quality issue.
Pre-define every metric users will want. Don’t assume Cortex will infer derived calculations. Gross margin, discount rates, ARR changes — anything that’s a ratio, percentage, or multi-column calculation needs an explicit METRICS definition. If it’s not in the semantic view, it either fails or produces wrong SQL silently.
Set scope expectations early. Cortex Analyst is not a replacement for a BI tool on complex queries. It’s fast, flexible, and surprisingly accurate on aggregation questions. It’s unreliable on queries that require multi-step logic or domain-specific calendar definitions that aren’t in the schema. Sigma stayed in the stack. The semantic layer added a capability; it didn’t replace an existing one.
Use the post-hook pattern. Running create_semantic_view() as a post-hook on the source mart keeps the semantic view current without a separate process. Without it, schema evolution quietly breaks the semantic layer until someone notices wrong answers.
Where should a mid-market team start?
If you’re weighing this, the sequencing question matters more than the tool question.
Start only if your numbers are already defensible. If Finance and Sales still disagree about last quarter’s revenue, an AI layer won’t settle it — it will hand both of them a citation. The prerequisite is a modeled, tested warehouse whose key numbers reconcile against an independent source, which is the work described in our analytics platform modernization case study.
Scope the first semantic view to one domain and one audience. One mart, one set of metrics, one group of people whose questions you can enumerate. A semantic view covering everything is a program. A semantic view covering monthly revenue by product is a weekend and a validation pass.
Write the metric list before you write any DDL. Ask the target audience for the twenty questions they actually ask. Every metric implied by those twenty goes in the METRICS block. Anything you leave out doesn’t degrade gracefully — it becomes either a wrong answer or a refusal.
Budget for the semantic layer, not the AI. The AI part is a configured service. The semantic layer is modeling work, and that’s where the time goes — which is also why the investment outlives whichever model you’re using this year. Swap the LLM, keep the definitions.
Decide the failure policy up front. What happens when the tool produces a number someone repeats in a meeting? Our answer was a visible note about the calendar limitation, plus results validated against Sigma before anyone relied on them. Not elegant. It’s the difference between a tool people trust appropriately and one they trust completely for about six weeks.
If you have a validated dbt environment and want to know whether Cortex Analyst is worth the investment, we can run a scoped experiment on your actual data. It’s the same sequencing we bring to every AI strategy engagement: governed data first, semantic layer second, AI last. Get in touch.
Frequently asked questions
How do I put an LLM on my company's data safely?
Put a semantic layer between the model and the warehouse, and build it in order: a modeled, tested foundation whose numbers reconcile against an independent source; then a semantic layer that defines every metric as one deterministic expression; then the LLM on top, with the generated SQL visible on every answer. In that architecture the model's job is translation — turning a question into a query — while the warehouse does the arithmetic, so the number an executive sees is computed exactly the way the dashboard computes it. Access control stays where it already is: generated SQL is still just SQL, so masking policies and row access policies apply to it the same way they apply to a query someone types by hand.
What is a semantic layer for AI?
A semantic layer is a machine-readable definition of your business: which tables hold facts, which columns are dimensions worth grouping by, and what each metric means as an exact expression — so "net revenue" becomes one specific SUM on one table at one grain instead of a phrase every tool interprets for itself. For AI it does something a bigger model cannot: it shrinks the space of possible answers to the ones you have already sanctioned, which is why the same question returns the same SQL every time. And because the definitions live in code beside your dbt models, they get reviewed in pull requests and change in one place, so the dashboard and the AI answer move together instead of drifting apart.
What is Snowflake Cortex Analyst?
Cortex Analyst is Snowflake's managed natural-language-to-SQL service. You give it a semantic model — a Snowflake semantic view, which you can create over your dbt mart tables with a DDL macro — and it answers plain-English questions by generating SQL constrained to that model, executing it in your warehouse, and returning the result together with the SQL it wrote. Two properties matter more than the model behind it: it can only query what the semantic view exposes, and every answer is inspectable because the SQL comes back with it. Cortex is a fast-moving surface, so verify specific behavior against current Snowflake documentation before you design around it.
Can an LLM query my data warehouse directly?
It can, and we would not recommend it for numbers anyone will act on. Pointed at a raw schema, a model has no tiebreaker between the several columns that could plausibly be "revenue", no declaration of a fact table's grain — so a fan-out join produces a number that is quietly double — and no boundary, which means every table including the ones holding PII is in scope. A semantic view fixes all three: it names the one metric that counts, declares the grain as a primary key, and makes "what can this thing see?" a one-line answer for a security reviewer. The semantic layer decides what can be asked; Snowflake's RBAC decides what can be seen.
How accurate is natural language to SQL on financial data?
It splits by question type rather than averaging into a single number. On aggregation and grouping questions against a well-defined semantic view — sum this, group by that, filter to a period — our results matched the Sigma dashboards built on the same dbt models. On multi-condition filters, multi-step logic, and anything depending on a fiscal calendar the semantic view does not encode (ours is 4-4-5, so "Q3" meant the wrong three months), the output was sometimes correct and sometimes subtly wrong, and we could not predict which without checking it against a known answer. That unpredictability, not the average hit rate, is what should shape how you deploy it: show the generated SQL, and keep sign-off numbers in the tool that gets them right every time.
Do we still need a BI tool if we have conversational analytics?
Yes. Sigma stayed in our stack for exactly the queries Cortex Analyst was weakest on — fiscal-calendar reporting, multi-filter analysis, and any number that gets signed. What the semantic layer added was a fast path for the long tail of questions that never justified building a dashboard and never quite justified interrupting an analyst. Conversational analytics is a queue-reducer, not a BI replacement, and budgeting it as a replacement is how these projects end up judged a failure at something they were never doing.